With the 3rd quarter in the books, let’s take a look at how 2013 has looked:

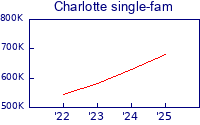
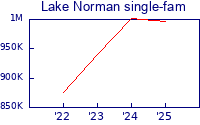
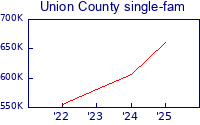
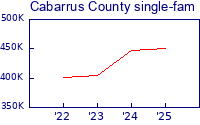
Now those are some nice charts, eh? The biggest gains are in the city of Charlotte & Mecklenburg County – both are up over 10% from 2012!
Even condos aren’t doing too badly:
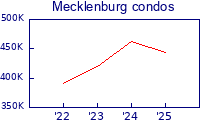
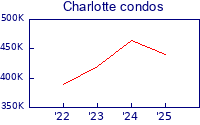
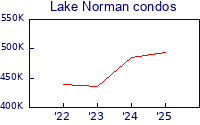
Overall, condos are up 8-10% from 2012 in Charlotte/Mecklenburg, and we’re seeing minimal gains in most areas other than uptown:
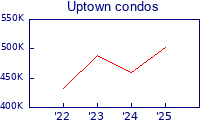
However, though uptown condo values are down, activity is up:
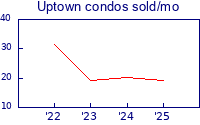
As always, feel free to steal these graphs and let us know if you have questions, or if there’s any data we can crunch for you!